MeteorにD3を導入
発端
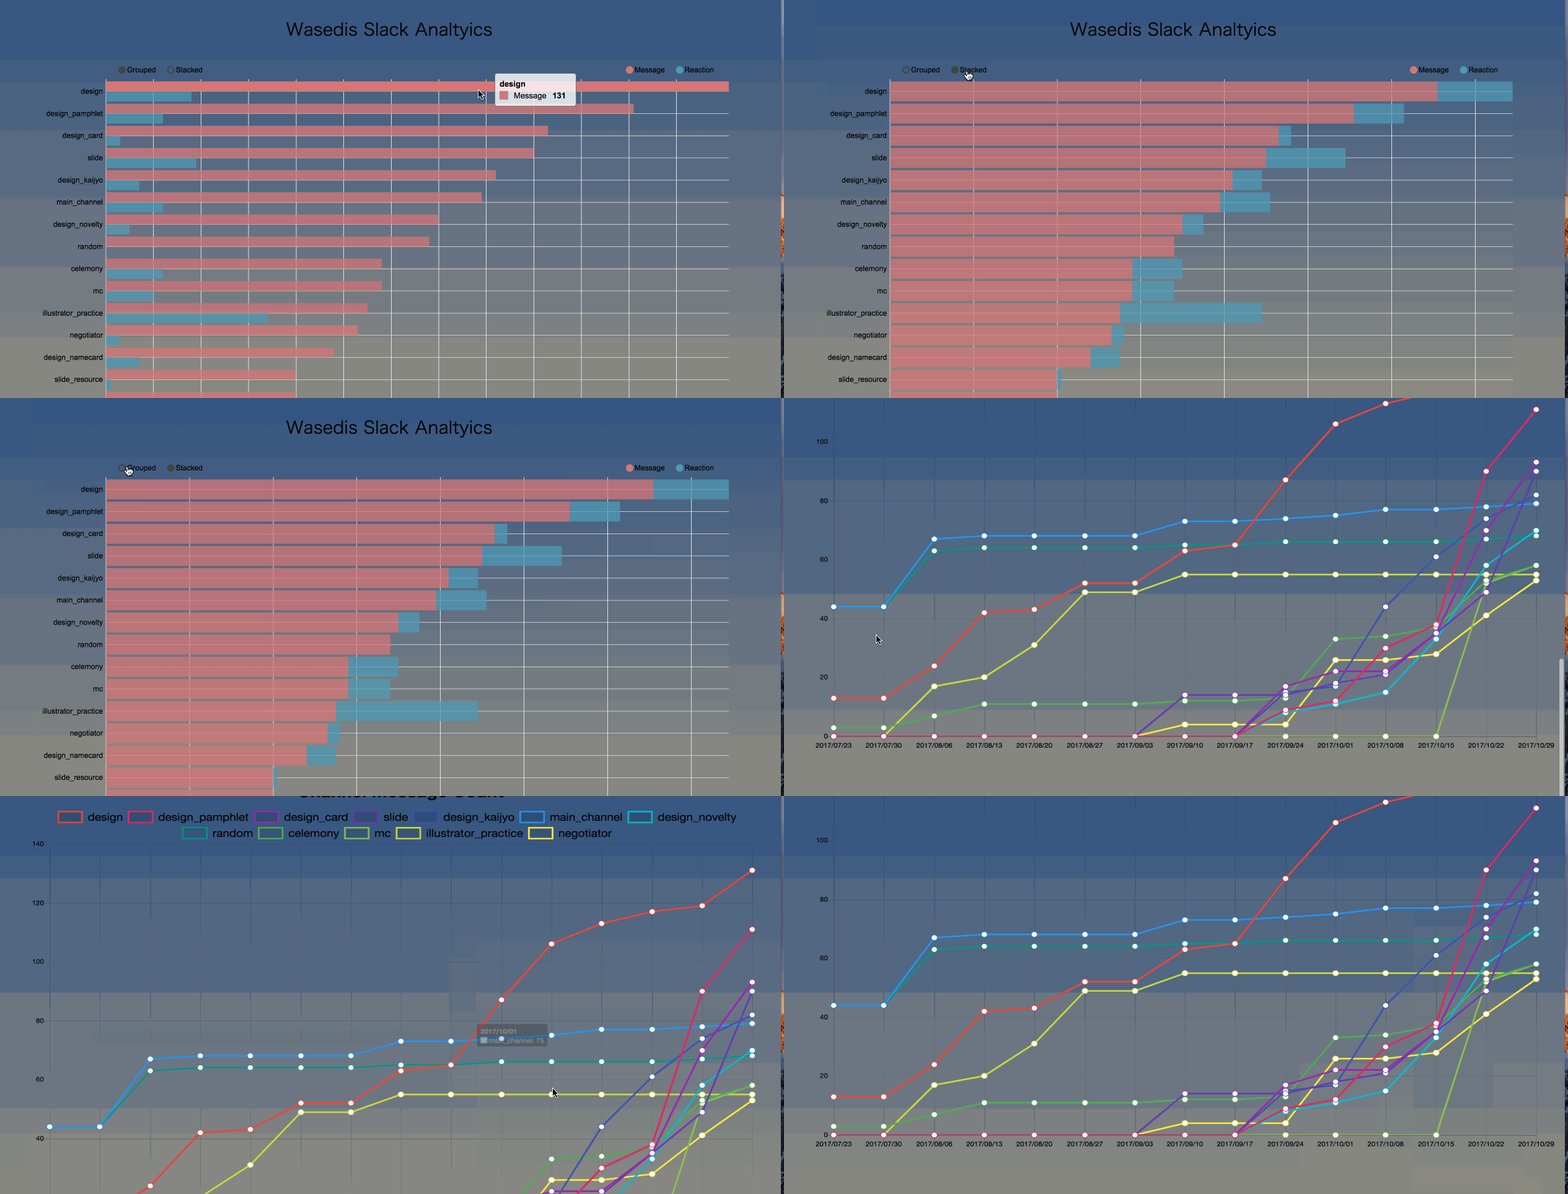
サークルで、Slackを使っているので、そのトークを分析したいと思い、D3 × Slackを試してみることに
導入
今回は、nvd3を使用した。実は、最初はD3で一から組んでいたが、学習コストが高く諦めることに。。。
以下のコンソールで、D3を勉強するページは非常にわかりやすかった!
【D3.js】超基本! コンソールでselect,data,enterメソッドを理解する。
Meteorへの導入は、以下のコマンドを叩くだけ
$ meteor npm install nvd3 --save
$ meteor add nvd3:nvd3
実際のコード
ほぼ、以下のページのコードのコピペ。
Horizontal Multi-Bar Chart
import { config } from '../../config'
import * as d3 from 'd3';
import * as nv from 'nvd3';

import '../../client/main.html';

// type declare
interface elementType {
  id: string
  name: string;
}

interface channelDataType {
  reaction: number;
  message: number;
}

interface d3DataType extends channelDataType {
  name: string;
}

interface d3BarDataType {
  key: string;
  color: string;
  values: { label: string; value:number; } [];
}

// get necessary data
function getData (data):channelDataType[] {
  const channelData = [];

  let reactionCount: number = 0;
  const messageCount: number = data.length;

  data.forEach(element => {
    if (element.reactions !== undefined) {
      element.reactions.forEach(value => {
        reactionCount += value.count;
      });
    }
  });

  channelData['reaction'] = reactionCount;
  channelData['message'] = messageCount;
  return channelData;
}

// get each channel data
async function getChannelInfo(element:elementType) {
  let getPostUrl:string = 'https://slack.com/api/channels.history?token=' + config.token
    + '&channel=' + element.id + '&count=500';
  const response = await fetch(getPostUrl);
  const json = await response.json();
  const channelData = getData(json.messages);
  return channelData;
}

// get all channel data
async function getAllChannelInfo() {
  const getChannelsUrl:string  = 'https://slack.com/api/channels.list?token=' + config.token
        + '&exclude_archived=true';
  try {
    const allChannelData = [];
    const response = await fetch(getChannelsUrl);
    const json = await response.json();
    json.channels.forEach(element => {
      const channelData = getChannelInfo(element).then(val =>
        { val['name'] = element.name; return val; });
      allChannelData.push(channelData);
    });
    return allChannelData;
  } catch (error) {
    console.log(error);
  }
};

// formatting data
function formatData(data) {
  const filterData = data.filter(function(element){
    return (element.message > 15);
  }).sort(function(x, y){
    return y.message - x.message || y.reaction - x.reaction;
  });

  const formatDataForBar: d3BarDataType[] = [
    { key:"Message", color:"#d67777", values:[] },
    { key:"Reaction", color:"#4f99b4", values:[] },
  ];

  filterData.forEach(val=> {
    /* For Bar chart */
    formatDataForBar[0].values.push({ label: val.name, value: val.message });
    formatDataForBar[1].values.push({ label: val.name, value: val.reaction });
  })

  return formatDataForBar;
}

// draw d3 bar graph
function d3BarDraw (d3Data) {
  nv.addGraph(function() {
    const chart = nv.models.multiBarHorizontalChart()
        .x(function(d) { return d.label })
        .y(function(d) { return d.value })
        .margin({top: 30, right: 20, bottom: 50, left: 175});

    chart.yAxis
        .tickFormat(d3.format("01d"));

    d3.select('#bar-graph svg')
        .datum(d3Data)
        .call(chart);

    nv.utils.windowResize(chart.update);

    return chart;
  });
}

// draw d3 graph
function drawBarGraph () {
  const alldata = getAllChannelInfo();

  alldata.then(e => {
    Promise.all(e).then((d3Data:d3DataType[]) => {
      // arrrange data
      return formatData(d3Data);
    }).then((d3FilterData):void => {
      // draw graph
      d3BarDraw(d3FilterData);
  });
};

// Draw Bar Graph
drawBarGraph();
結論
D3は、やっぱり学習コスト高め。凝った、アニメーションが必要でなければChart.jsで十分対応できる! ちなみに、以下のGifの下の折れ線グラフは、Chart.jsで作成してますー
[DEMO]


