こんにちは。hacknoteのr.katoです。
今回はwindows serverのリソースを監視するにあたってPrometheusをwindows serverで使ってみましたので導入方法を紹介していきます。
導入したもの
- Prometheus(amd64) ver.2.8.0
- WMI exporter(amd64) ver.0.6.0
- Grafana(amd64) ver.5.2.2
WMI exporter(amd64) ver.0.6.0
https://github.com/martinlindhe/wmi_exporter/releases
からwmi_exporter-0.6.0-amd64.exeをダウンロードします。
そして解凍後、適当なディレクトリに置いて、 wmi_exporter-0.6.0-amd64.exe を実行します。
Prometheus(amd64) ver.2.8.0
https://prometheus.io/download/
からprometheus-2.8.0-rc.0.windows-amd64.tar.gzをダウンロードします。
そして解凍後、適当なディレクトリに置いて、 prometheus-2.8.0-rc.0.windows-amd64>prometheus.yml ファイルを編集し、末尾の方にある[‘localhost:9090’]を[‘localhost:9182’]に書き換えてください。
そして、 prometheus.exe を実行します。
Grafana(amd64) ver.5.2.2
ここのwgetの横に書いてあるURLにアクセスすると、ダウンロードが始まるので、そのままダウンロードをし、解凍し適当なディレクトリに置いておく。
そして、C:\grafana\dataといったフォルダを作成してください。
conf/sample.iniを適当な名前で複製しconf/config.iniといった様にし、config.iniを次の様に編集してください。
編集前
# Path to where grafana can store temp files, sessions, and the sqlite3 db (if that is used)
;data = /var/lib/grafana

# Directory where grafana can store logs
;logs = /var/log/grafana

# Directory where grafana will automatically scan and look for plugins
;plugins = /var/lib/grafana/plugins
編集後
# Path to where grafana can store temp files, sessions, and the sqlite3 db (if that is used)
# ;data = /var/lib/grafana
;data = C:\grafana\data

# Directory where grafana can store logs
# ;logs = /var/log/grafana
;logs = C:\grafana\data\log

# Directory where grafana will automatically scan and look for plugins
# ;plugins = /var/lib/grafana/plugins
;plugins = C:\grafana\data\plugins
grafana/binで次を実行してください。
grafana-server.exe --config ..\conf\config.ini
ブラウザにて
Prometheusを導入したwindows serverでwebブラウザを起動し、http://localhost:9182/metricsにアクセスすれば、WMI exporterがアクセスした瞬間のリソース情報が、http://localhost:9090にアクセスすれば、PrometheusのWEB UIにアクセスでき、http://localhost:3000にアクセスすればGrafanaにアクセスすることができます。Grafanaの初期IDとPassはどちらもadminです。
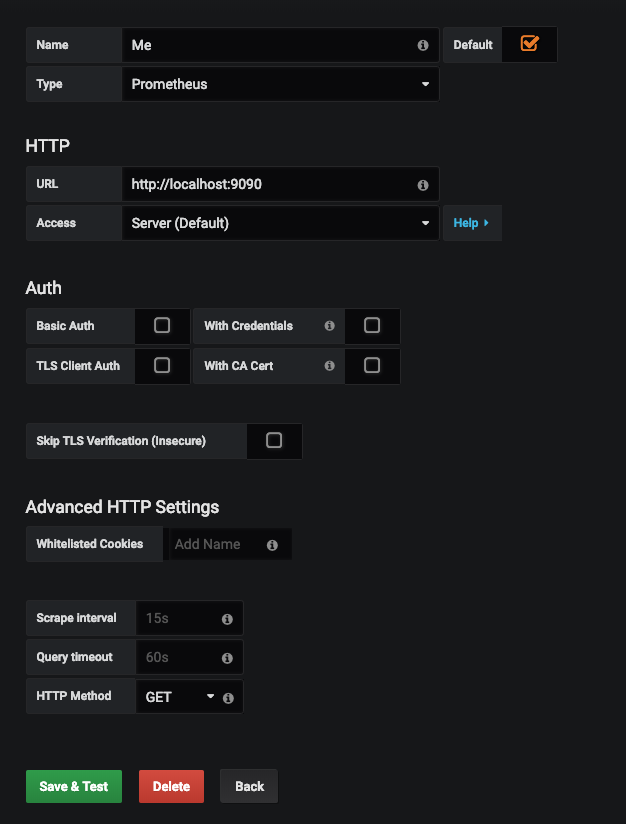
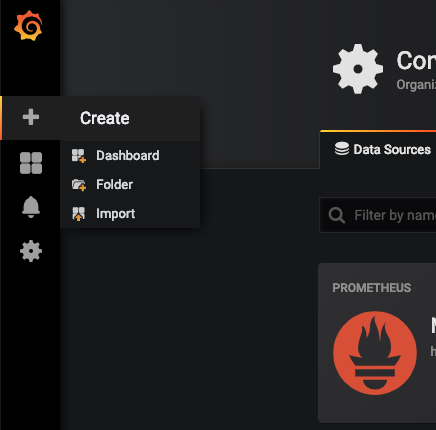
GrafanaにアクセスするとDataのソースを求められると思います。次の様にすればOKです。
次にこちらにアクセスし、Windows nodeをjsonでダウンロードします。

そしてブラウザ左側のImportを使ってダウンロードしたjsonをアップロードしてインストールしていきます。
それらが全て終了し、3000番ポートをひらけば外部からも監視が可能となります。(URL:3000)