yumコマンドでCloudWatch エージェントをインストールできるようになりました。(Amazon Linux2のみ)
Amazon CloudWatch エージェントがオープンソースになり、Amazon Linux 2に含まれる
これまではAWS Systems Managerかコマンドで手動インストールするかの2つの方法でしたが、今回のアップデートにより、yumを使ったたった1行でインストール出来るようになりました。
CloudWatch エージェントを使ってみよう
1. IAMロールを作成する
IAMロールを作成します。ユースケースの選択で「EC2」を選択します。 AWS側で用意されているポリシー「CloudWatchAgentServerPolicy」と「CloudWatchAgentAdminPolicy」をロールにアタッチします。
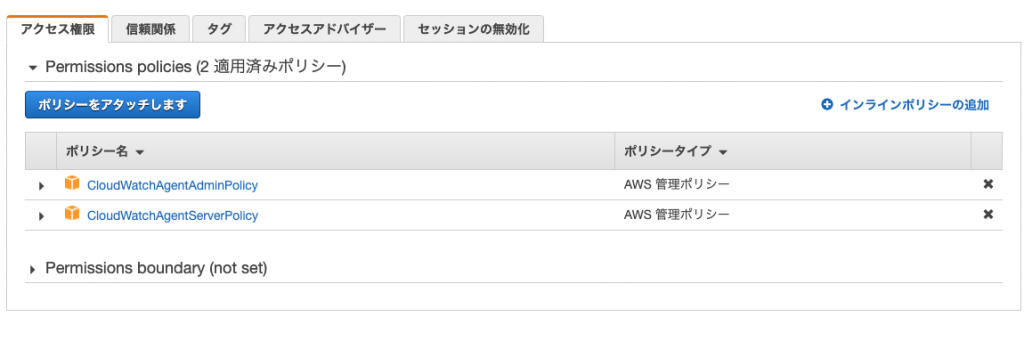
作成したIAMロールをEC2インスタンスにアタッチします。
2. CloudWatchエージェントをインストールする
[root@ip- ~]# yum install amazon-cloudwatch-agent
これだけで簡単にインストールされます。
3. エージェント設定ファイルの作成
ウィザードを使用して対話型で作成していきます。
[root@ip- ~]# /opt/aws/amazon-cloudwatch-agent/bin/amazon-cloudwatch-agent-config-wizard
=============================================================
= Welcome to the AWS CloudWatch Agent Configuration Manager =
=============================================================
On which OS are you planning to use the agent?
1. linux
2. windows
default choice: [1]:
1
Trying to fetch the default region based on ec2 metadata...
Are you using EC2 or On-Premises hosts?
1. EC2
2. On-Premises
default choice: [1]:
1
Which user are you planning to run the agent?
1. root
2. cwagent
3. others
default choice: [1]:
1
Do you want to turn on StatsD daemon?
1. yes
2. no
default choice: [1]:
2 ##StatsDプラグインがインストールされているときのみyes
Do you want to monitor metrics from CollectD?
1. yes
2. no
default choice: [1]:
2  ##CollectDプラグインがインストールされているときのみyes
Do you want to monitor any host metrics? e.g. CPU, memory, etc.
1. yes
2. no
default choice: [1]:
1
Do you want to monitor cpu metrics per core? Additional CloudWatch charges may apply.
1. yes
2. no
default choice: [1]:
1
Do you want to add ec2 dimensions (ImageId, InstanceId, InstanceType, AutoScalingGroupName) into all of your metrics if the info is available?
1. yes
2. no
default choice: [1]:
1
Would you like to collect your metrics at high resolution (sub-minute resolution)? This enables sub-minute resolution for all metrics, but you can customize for specific metrics in the output json file.
1. 1s
2. 10s
3. 30s
4. 60s
default choice: [4]:
4
Which default metrics config do you want?
1. Basic
2. Standard
3. Advanced
4. None
default choice: [1]:
2
Current config as follows:
{
    "agent": {
        "metrics_collection_interval": 30,
~~~~~
~~~~~


Are you satisfied with the above config? Note: it can be manually customized after the wizard completes to add additional items.
1. yes
2. no
default choice: [1]:
1
Do you have any existing CloudWatch Log Agent (http://docs.aws.amazon.com/AmazonCloudWatch/latest/logs/AgentReference.html) configuration file to import for migration?
1. yes
2. no
default choice: [2]:
2
Do you want to monitor any log files?
1. yes
2. no
default choice: [1]:
1
Log file path:
/var/log/messages
Log group name:
default choice: [.]
***
Log stream name:
default choice: [{instance_id}]
***
Do you want to store the config in the SSM parameter store?
1. yes
2. no
default choice: [1]:
1
What parameter store name do you want to use to store your config? (Use 'AmazonCloudWatch-' prefix if you use our managed AWS policy)
default choice: [AmazonCloudWatch-linux]

Trying to fetch the default region based on ec2 metadata...
Which region do you want to store the config in the parameter store?
default choice: [ap-northeast-1]

Which AWS credential should be used to send json config to parameter store?
1. ASIAV5IV******(From SDK)
2. Other
default choice: [1]:

Please make sure the creds you used have the right permissions configured for SSM access.
Which AWS credential should be used to send json config to parameter store?
1. ASIAV5IV******(From SDK)
2. Other
default choice: [1]:

~~~~~~~~
Program exits now.
4. ファイルを編集する
上記の選択に合わせて/opt/aws/amazon-cloudwatch-agent/binに設定ファイルconfig.jsonが作成されます。
ウィザードでのメトリクスの編集レベルをstandardにした場合設定されるメトリクスは
- CPU: cpu_usage_idle, cpu_usage_iowait, cpu_usage_user, cpu_usage_system
- Disk: disk_used_percent, disk_inodes_free
- Diskio: diskio_io_time
- Mem: mem_used_percent
- Swap: swap_used_percent
です。advanceにした場合、standardの内容にプラスして
- Diskio: diskio_write_bytes, diskio_read_bytes, diskio_writes, diskio_reads
- Netstat: netstat_tcp_established, netstat_tcp_time_wait
が設定されます。
自分でメトリクスの種類をカスタマイズしたいときは手動でconfig.jsonを変更していきます。 各メトリクスの詳細はドキュメントで確認することができます。 CloudWatch エージェントにより収集されるメトリクス
5. CloudWatch エージェントを起動する
SSMパラメータストアの設定ファイルでAgentを起動します。
[root@ip- ~]# /opt/aws/amazon-cloudwatch-agent/bin/amazon-cloudwatch-agent-ctl -a fetch-config -m ec2 -c ssm:AmazonCloudWatch-linux -s
[root@ip- ~]# /opt/aws/amazon-cloudwatch-agent/bin/amazon-cloudwatch-agent-ctl -m ec2 -a start

## ステータスの確認
[root@ip- ~]# /opt/aws/amazon-cloudwatch-agent/bin/amazon-cloudwatch-agent-ctl -m ec2 -a status
{
  "status": "running",
  "starttime": "2020-10-16T08:33:08+0000",
  "version": "1.247345.35"
}
6. 動作の確認
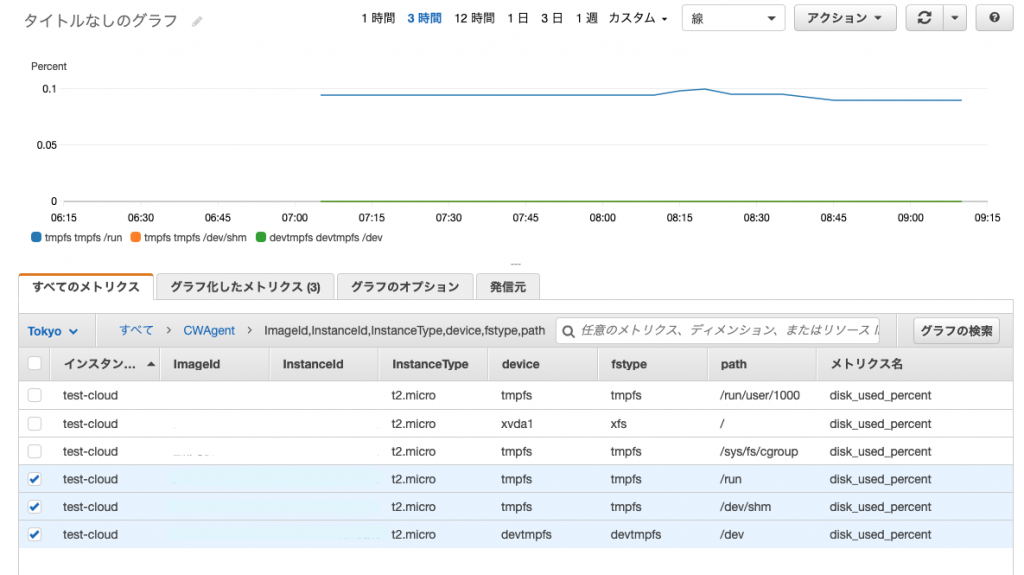
CloudWatchのコンソールでメトリクスを確認するとカスタム名前空間 「CWAgent」 が出来ています。
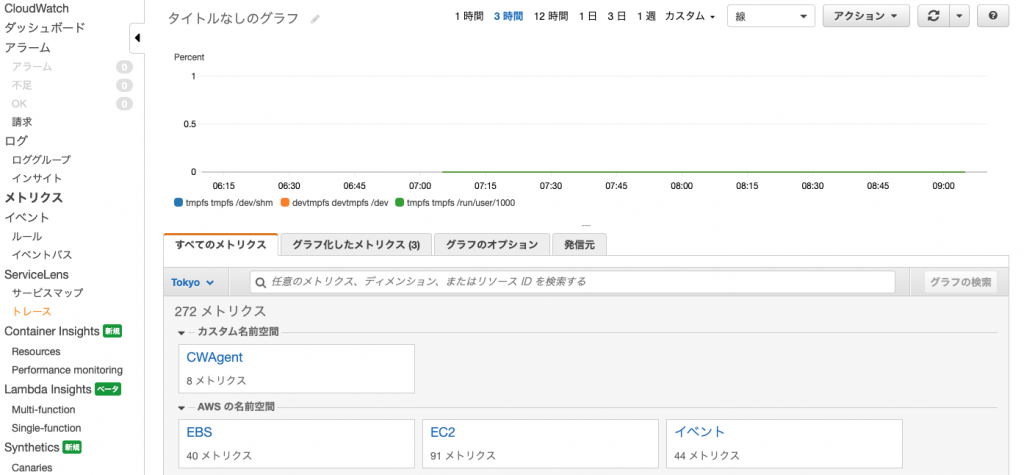
それぞれのメトリックを確認することができます。
7. CloudWatch エージェントを停止する
[root@ip- ~]# /opt/aws/amazon-cloudwatch-agent/bin/amazon-cloudwatch-agent-ctl -m ec2 -a stop